2026-06-26 · 5 min read
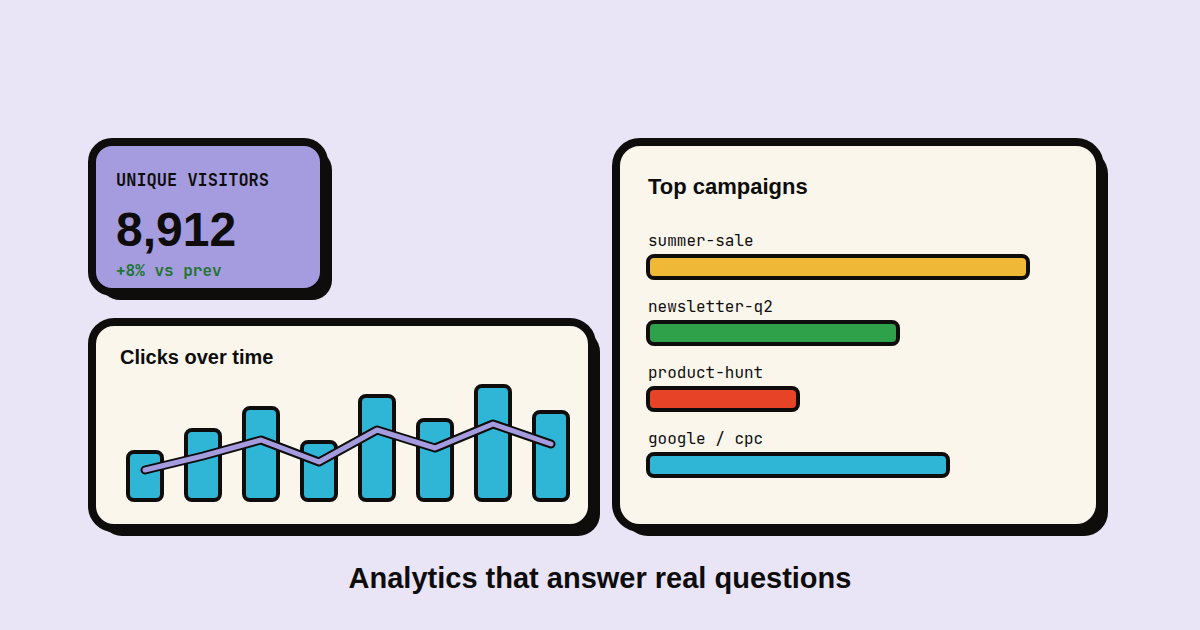
Analytics that answer real questions, not just count clicks.
Unique visitors, campaign and channel performance, OS / language / region breakdowns, a previous-period comparison line, bot filtering, and a stats page you can share with a client. Server-side and privacy-safe, no pixel.
A raw click count tells you something happened. It doesn't tell you whether the campaign worked, whether those were 5,000 people or one person hitting refresh, or which channel actually pulled its weight. This round of analytics is about the questions a marketer actually asks, answered the BLNQ way: server-side at the redirect, no tracking pixel, and without storing anyone's IP.
Unique visitors, counted without tracking anyone
The headline number most dashboards bury. "5,000 clicks" reads very differently once you know it was 1,900 people. The Overview now shows unique visitors next to total clicks, with the same up-or-down delta.
How we count it is the part we're proud of. For each click we compute a one-way hash of the visitor's IP, user-agent, and the link id, salted with a secret plus the current date, and we count the distinct hashes. We never store the IP, and because the salt rotates every day at midnight UTC, the same person tomorrow is a different hash, so there is no durable identifier sitting in our database to leak or subpoena. It's an estimate, deliberately, and a privacy-safe one.
Which campaign, and which channel, actually worked
Two new breakdowns on the Audience tab. Top campaigns ranks your campaigns by clicks, so the launch push and the evergreen newsletter link stop being one undifferentiated blob. Channels reads the UTM tags on your links (source / medium) and ranks them, so you can see that google / cpc out-pulled twitter / social this month without exporting anything to a spreadsheet.
Both are computed by joining clicks to links to your saved UTM templates, so there's nothing new to tag by hand beyond the UTM templates you were already using.
The breakdowns that were missing: OS, language, region
We already split clicks by country, browser, and device. Three more joined them. Operating system (iOS / Android / Windows / macOS / Linux) is the cut that mobile-vs-desktop never quite captured. Language comes from the visitor's Accept-Language header, the primary tag only, so you learn your audience reads Spanish before you pay for a translation. Region breaks each country down to state or province from the edge's geo lookup, so "United States" becomes California, Texas, New York.
Are you up or down? The previous-period line
A number with no baseline is just a number. The clicks-over-time chart now draws the previous period as a line over the bars: the last 30 days as bars, the 30 days before that as the line. If this period's bars sit above the line you're growing; if they're under it, you're not. It's the fastest way to read the chart.
Bots don't count
Link-preview fetchers, uptime monitors, and crawlers all hit redirects, and they were quietly inflating every number. We now flag obvious bot user-agents when the click is written and exclude them from the totals, the unique count, and every breakdown. The numbers you see are humans, which is also what keeps the previous-period comparison honest.
A stats page you can hand a client
Sometimes the person who needs the numbers doesn't have a BLNQ login: a client, a stakeholder, whoever paid for the campaign. Turn on the public stats page for a link and you get a read-only URL at blnq.it/s/<token> with the clicks-over-time chart, unique visitors, QR scans, top countries, and the device split, and nothing else. No destination URL, no other links, no personal data. It's gated by an unguessable token, so it stays private until you share it and goes dark the moment you switch it off. There's a small "Made with BLNQ" footer, which is the only string attached.
Where to find it
Unique visitors and the previous-period line are on the Overview tab; the OS, campaign, channel, language, and region breakdowns are on Audience; the public stats toggle is in each link's editor. How far back you can look is still your plan's retention window, 30 days on Free up to a year on Agency. And it's the same promise as before: counted on our server when the redirect fires, never with a script in the visitor's browser.